
ไฟล์:Mauna Loa Carbon Dioxide-en.svg

ดูภาพที่มีความละเอียดสูงกว่า ((ไฟล์ SVG, 850 × 547 พิกเซล, ขนาดไฟล์: 16 กิโลไบต์))
| รูปภาพหรือไฟล์เสียงนี้ ต้นฉบับอยู่ที่ คอมมอนส์ รายละเอียดด้านล่าง เป็นข้อความที่แสดงผลจาก ไฟล์ต้นฉบับในคอมมอนส์
|
ความย่อ
| คำอธิบาย |
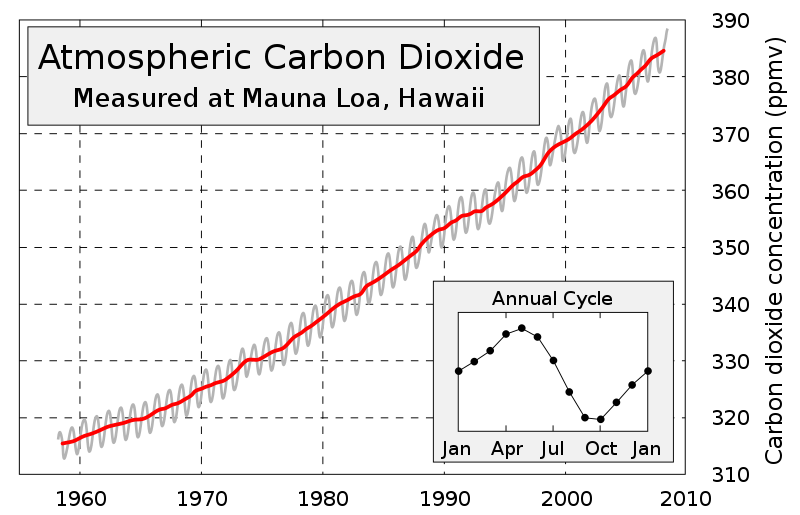
English: This figure shows the history of atmospheric carbon dioxide concentrations as directly measured at Mauna Loa, Hawaii. This curve is known as the Keeling curve, and is an essential piece of evidence of the man-made increases in greenhouse gases that are believed to be the cause of global warming. The longest such record exists at Mauna Loa, but these measurements have been independently confirmed at many other sites around the world [1].
The annual fluctuation in carbon dioxide is caused by seasonal variations in carbon dioxide uptake by land plants. Since many more forests are concentrated in the Northern Hemisphere, more carbon dioxide is removed from the atmosphere during Northern Hemisphere summer than Southern Hemisphere summer. This annual cycle is shown in the inset figure by taking the average concentration for each month across all measured years. The grey curve shows the average monthly concentrations, and red curve is a moving 12 month average.Français : Évolution de la teneur atmosphérique en dioxyde de carbone, mesurée depuis le volcan Mauna Loa, dans l'île de Hawaii. La courbe de cette évolution est connue sous le nom de « courbe de Keeling », et est une preuve évidente de la production humaine de gaz à effet de serre et de son impact sur le réchauffement climatique. C'est sur le Mauna Loa que les taux mesurés sont les plus élevés, mais on retrouve la même évolution sur d'autres sites dans le monde (voir ici).
La fluctuation annuelle de dioxyde de carbone est dûe aux variation saisonnière causées par les plantes. Comme beaucoup de forêts se trouvent dans l'hémisphère nord, il y a plus de rejet de gaz carbonique dans l'atmosphère durant l'été septentrional que pendant l'été austral. Ce cycle annuel est indiqué dans l'encart en bas à droite de l'image, et montre la concentration moyenne de gaz au cours des différents mois. Ce cycle se répète quelle que soit l'année observée. La courbe grise montre la teneur moyenne mensuelle de dioxyde de carbone, et la courbe rouge représente la moyenne annuelle. |
||
| วันที่ | |||
| แหล่งที่มา | Image:Mauna Loa Carbon Dioxide.png, uploaded in Commons by Nils Simon under licence GFDL & CC-NC-SA ; itself created by Robert A. Rohde from NOAA published data and is incorporated into the Global Warming Art project. | ||
| ผู้สร้างสรรค์ | Sémhur | ||
| เวอร์ชันอื่น |
[]
Updated version (2015)
| ||
| การแสดงที่มา (จำเป็นต้องมีตามสัญญาอนุญาต) | © Sémhur / Wikimedia Commons / | ||
| SVG | W3C-validity not checked. ไฟล์ภาพกราฟิกส์เวกเตอร์ไม่ได้ระบุการตรวจโดย W3C นี้ สร้างขึ้นโดยใช้ Inkscape .
|
||
| Graphic Lab |

| ตำแหน่งที่ตั้งกล้อง | | ภาพนี้และภาพอื่น ๆ ณ สถานที่เดียวกันที่ OpenStreetMap |
|---|
การอนุญาตใช้สิทธิ
| กอปปีเลฟต์: งานศิลปะนี้ไม่มีมูลค่า คุณสามารถแจกจ่ายและ/หรือแก้ไขได้ภายใต้เงื่อนไข Free Art License คุณสามารถพบตัวอย่างของสัญญาอนุญาตนี้ได้บนไซต์ Copyleft Attitude รวมทั้งบนไซต์อื่น ๆ ด้วย |
- คุณสามารถ:
- ที่จะแบ่งปัน – ที่จะทำสำเนา แจกจ่าย และส่งงานดังกล่าวต่อไป
- ที่จะเรียบเรียงใหม่ – ที่จะดัดแปลงงานดังกล่าว
- ภายใต้เงื่อนไขต่อไปนี้:
- แสดงที่มา – คุณต้องให้เกียรติเจ้าของงานอย่างเหมาะสม โดยเพิ่มลิงก์ไปยังสัญญาอนุญาต และระบุหากมีการเปลี่ยนแปลง คุณอาจทำเช่นนี้ได้ในรูปแบบใดก็ได้ตามควร แต่ต้องไม่ใช่ในลักษณะที่แนะว่าผู้ให้อนุญาตสนับสนุนคุณหรือการใช้งานของคุณ
- อนุญาตแบบเดียวกัน – หากคุณดัดแปลง เปลี่ยนรูป หรือต่อเติมงานนี้ คุณต้องใช้สัญญาอนุญาตแบบเดียวกันหรือแบบที่เหมือนกับสัญญาอนุญาตที่ใช้กับงานนี้เท่านั้น
ประวัติไฟล์
คลิกวันที่/เวลาเพื่อดูไฟล์ที่ปรากฏในขณะนั้น
| วันที่/เวลา | รูปย่อ | ขนาด | ผู้ใช้ | ความเห็น | |
|---|---|---|---|---|---|
| ปัจจุบัน | 17:19, 29 มิถุนายน 2551 | | 850 × 547 (16 กิโลไบต์) | Sémhur | clean-up |
| 16:30, 27 มิถุนายน 2551 |  | 850 × 547 (31 กิโลไบต์) | Sémhur | Data updated (now, from 1958 to june 2008) | |
| 20:51, 23 เมษายน 2551 |  | 800 × 547 (33 กิโลไบต์) | Sémhur | Without the bitmap, it's better | |
| 20:48, 23 เมษายน 2551 |  | 800 × 547 (33 กิโลไบต์) | Sémhur | {{Information |Description= {{en|This figure shows the history of atmospheric carbon dioxide concentrations as directly measured at Mauna Loa, Hawaii. This curve is known as the [ |
หน้าที่มีภาพนี้
ไม่มีหน้าใดโยงมาที่ภาพนี้
การใช้ไฟล์ข้ามโครงการ
วิกิอื่นต่อไปนี้ใช้ไฟล์นี้:
- การใช้บน af.wikipedia.org
- การใช้บน ar.wikipedia.org
- การใช้บน en.wikipedia.org
- การใช้บน fr.wikipedia.org
- การใช้บน ko.wikipedia.org
- การใช้บน zh.wikipedia.org